Creating charts with Datawrapper
Figures are an important part of any scientific document. While the kind of figure commonly used obviously varies between disciplines, charts are an important part of many publications. There are two problems in how charts are currently used:
- the data used to draw the chart are not available or difficult to obtain
- charts are drawn as static images with no interactivity, e.g. to see the values of individual data points
Ross Mounce and others did a Figures → Data project at the recent hack4ac to extract data from figures, described in a blog post. The experience was painful, even though they started with a really simple chart.
While we should of course publish all data associated with a paper, the smarter strategy to overcome the two limitations above would be to embed the data used for a chart directly into the document. We have many tools that can accomplish this, and I have given an example using R in an earlier blog post. The problem is the sometimes steep learning curve.
One approach is to build an easy-to use online tool, and Datawrapper is exactly that:
An open source tool helping anyone to create simple, correct and embeddable charts in minutes.
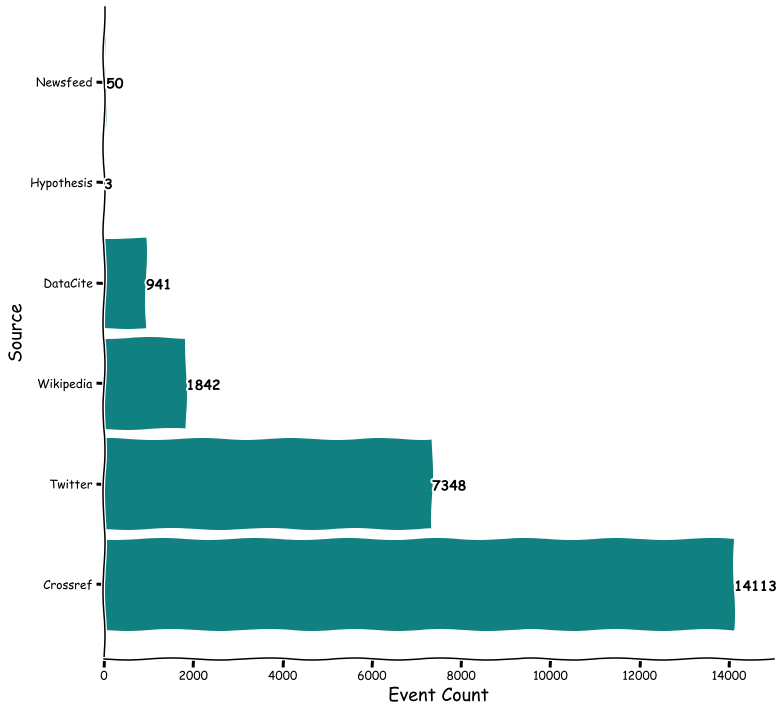
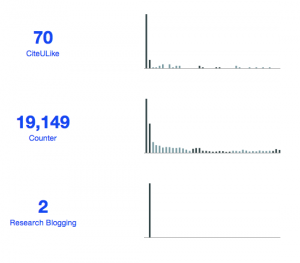
Datawrapper uses the d3.js and Highcharts Javascript libraries for data visualizations, and the service is easy to use. It took me for example about 15 min to generate the chart below. The data used for the chart are embedded (click Get the data) and you can hover over the chart to see the actual numbers by month.
Most journal articles see the highest usage immediately after publication, and the light purple line shows this pattern for Darcy et al. (2009). The dark purple line for Moher et al. (2009) – published on the same day – on the other hand shows a highly unusual usage pattern, as the usage actually increases over time, starting about 1 1/2 years after publication. The article is a guideline for reporting systematic reviews and meta-analyses, and is now viewed more often than directly after publication four years ago.
Datawrapper does three things: it makes it easy to generate charts, it allows you to embed them directly into your webpage (using an <iframe> tag), and it is Open Source software (MIT license, Github repo here) so that you can help improve the code and host this service on your own. DataWrapper was written in Javascript and PHP by a group of German journalists, and the main focus is data journalism where the service has become really popular with more than 3.5 million views of embedded charts in May 2013 alone.
Datawrapper is a perfect tool for science blogs and websites with scientific content, but it can also enhance the charts in scientific articles. We need a few additional chart types, error bars and more flexible labeling. And we might want to add a license picker, making it easy to add a Creative Commons license so that it is clear how the chart can be reused. Datawrapper is intended for online use, but the service can also save the charts as PNG or PDF. We would want to add saving to SVG (already used for online rendering) for easier embedding into the XML and ePub versions of articles.
References
D’Arcy, E., & Moynihan, R. (2009). Can the relationship between doctors and drug companies ever be a healthy one? PLoS Medicine, 6(7), e1000075. Retrieved from http://doi.org/10.1371/journal.pmed.1000075
Moher, D., Liberati, A., Tetzlaff, J., & Altman, D. G. (2009). Preferred reporting items for systematic reviews and meta-analyses: The pRISMA statement. PLoS Medicine, 6(7), e1000097. Retrieved from http://doi.org/10.1371/journal.pmed.1000097

Comments ()