In the first post of this new blog a few weeks ago I talked about Data-Driven Development, and that service monitoring is an important aspect of this. The main service DataCite is providing is registration of digital object identifiers (DOIs) for scholarly content, in particular research data.
Monitoring this service should include the following:
- number of DOIs registered
- metadata associated with these DOIs
- are the DOIs working as expected, e.g. are they resolving to the appropriate landing page
- are these DOIs actually used, based on number of downloads, citations, etc. of the resources they are describing
We can use the DataCite Search API to address #1 and #2. The DataCite Statistics Portal uses the API and is an excellent starting point for #1, showing the number of DOIs registered broken down by allocator and data center.
To get more detailed information about #1, and to look into #2, we can use the statistical programming language R and the rdatacite package by Scott Chamberlain from the rOpenSci to talk to the DataCite API. I have started to work on this and have created the public repository metadata-reports on Github for this purpose. The first two reports are
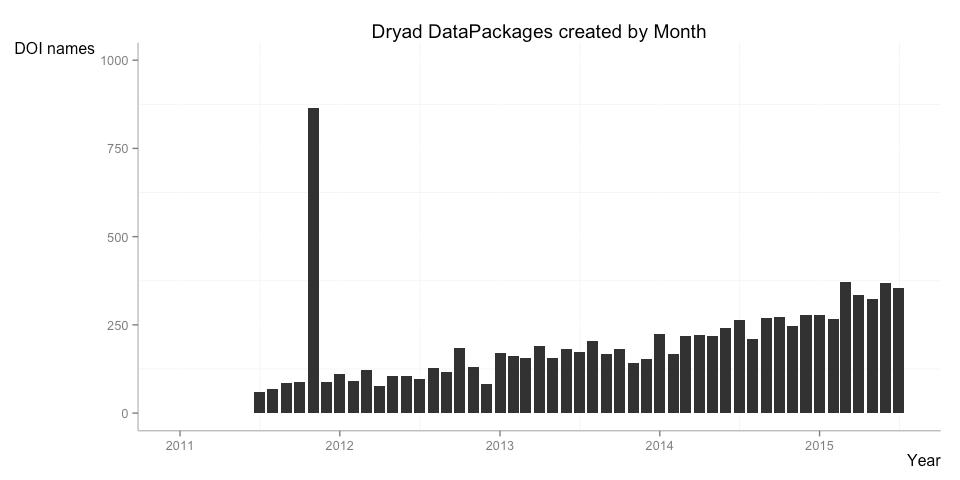
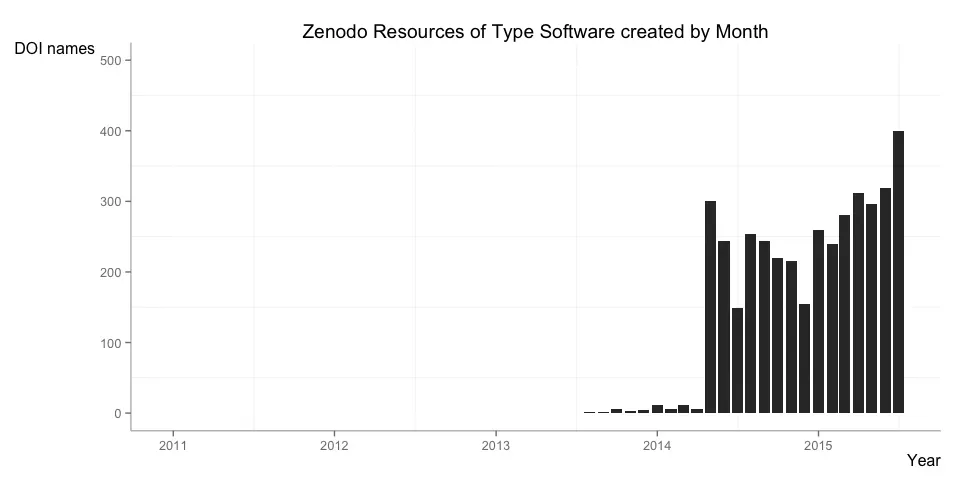
In the overview report I look at the number of DOI names registered over time, with some examples where these numbers are broken down by data center and resource type. Below are two examples for data packages from Dryad and software from Zenodo:

In the orcid report I look at the number of DOI names that have at least one Open Researcher and Contributor ID (ORCID) in the metadata.
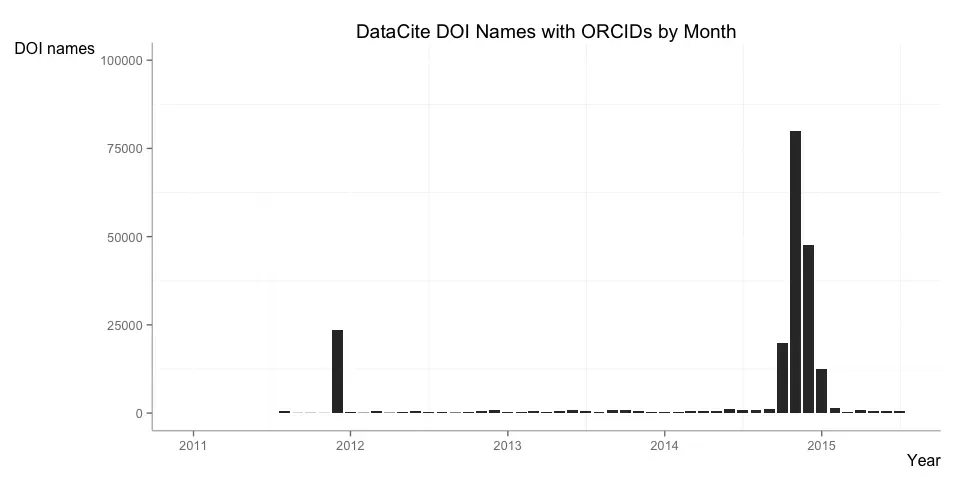
The report goes in more detail explaining the two peaks, basically two small group of researchers producing a large number of data sets (at Pangaea and Imperial College, respectively), and including their ORCID identifiers will all of them.
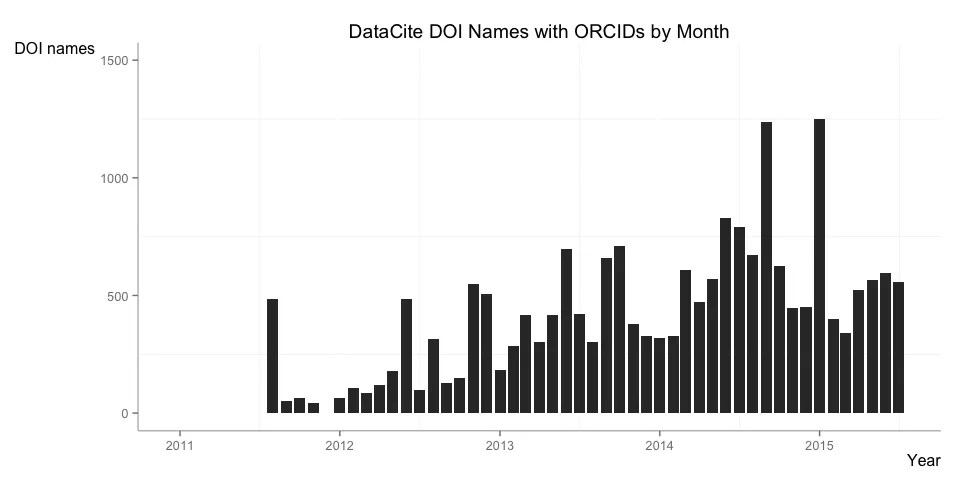
Removing these two groups of researchers shows a more organic pattern, with about 500 DOIs with associated ORCIDs created every month.
R is a nice reporting tool for these kinds of data, and the rdatacite, rmarkdown and knitr packages make the analysis and visualization a straightforward process. Feel free to adapt the code in the Github repository to your specific questions, or let me know what other reports you would like to see.
This blog post was originally published on the DataCite Blog.
