
In October I published an essay on Article-Level Metrics (ALM) in PLOS Biology (Fenner, 2013). The essay is a good introduction into Article-Level Metrics, and I am proud that it is part of the Tenth Anniversary PLOS Biology Collection. Like all PLOS content, the article was published with a Creative Commons attribution license, allowing me to republish the article on this blog. I have now done so and the article is available here.
Of course I didn’t want to simply republish the article, but I wanted to publish an improved version. The article has five figures, four of them show visualizations of ALM data that were generated using R (the fifth figure is a table reproduced from another article). The PLOS article includes the ALM dataset and the R scripts used to generate the figures as supplementary information. What I have done now is to recreate the article as a single markdown file (available here) that has all R code embedded. Using R and knitr - and the CSV file with the ALM data - everyone can now reproduce the figures from the paper by simply running the embedded code, and can dig deeper into the data.
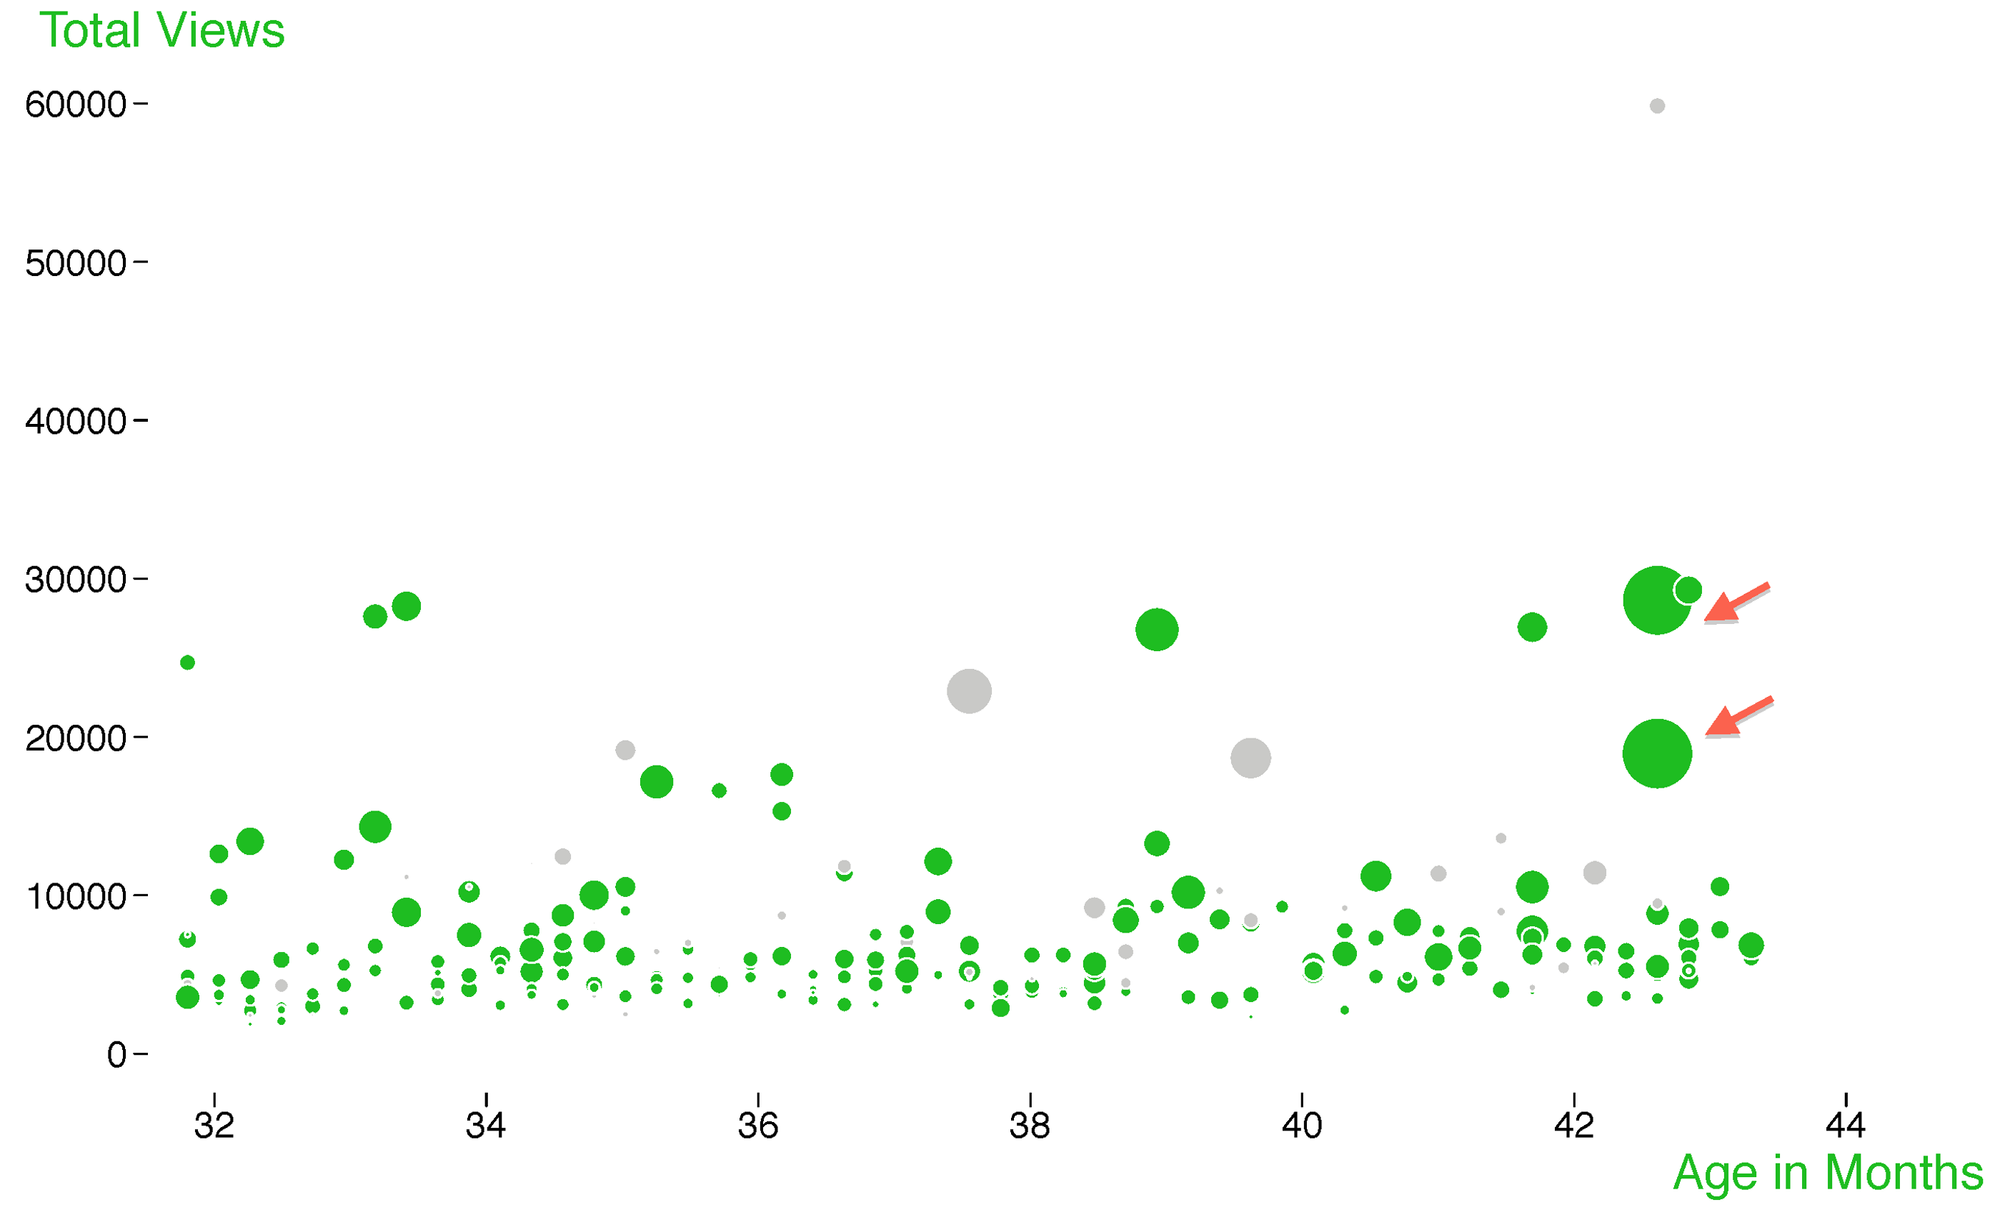
This was a good opportunity to improve the accessibility of the article in other ways. Instead of the raster image formats PNG, JPEG and TIFF used by PLOS and almost every other publisher, I generated the figures in the vector format SVG. Not only does SVG produce images independent of device resolution and screen size (try to zoom in on the figure above), but SVG can also easily be manipulated in the browser since it is XML. This is beyond the scope of this blog post, but look at the d3.js Javascript library for great examples of how SVG can be dynamically generated and changed in the browser. Figure 3 above could for example be enhanced so that the article title is displayed when you hover over one of the bubbles, or we could enable zooming to show more detail.
Like all content on this blog, the article was created using Pandoc, and the bibliography was dynamically generated. This makes it easy to change the citation style, and I decided to use the APA Style that shows the citations in the text as author-date rather than numbered as with the PLOS style (see the example citation in the first paragraph). The combined bibliography for all blog posts including the article can be downloaded in bibtex format here.
Lastly, I wanted to generate nicer HTML for a better online reading experience. I haven’t done anything fancy, but most publishers seem to focus on navigation around an article, so that very little screen real estate is left for the actual content of the article. I’ve tried to improve readability by reducing the navigation areas to a minimum, by using readable fonts in larger sizes: Adobe Minion Pro for the body text and Adobe Myriad Pro for headings, tables and figure legends.
References
Fenner, M. (2013). What can article-level metrics do for you? PLoS Biol, 11(10), e1001687. doi:10.1371/journal.pbio.1001687
