This paper in markdown format was written by Ethan White et al. The markdown file and the associated bibliogaphy and figure files are available from the Github repository of the paper.
I used this version, an earlier version was published as PeerJ Preprint. Special thanks to Ethan White for allowing me to reuse this paper. The paper is used here as an example document to show how markdown can handle scholarly documents, in particular tables, figures and citations. The document was slightly modified from the orginal: added YAML frontmatter (needed by jekyll, author names are also stored there), and changed the anchor text for some links. This post is using the APA citation style. Please restrict your comments to issues related to Scholarly Markdown, for the content of the article contact Ethan directly.
Abstract
Sharing data is increasingly considered to be an important part of the scientific process. Making your data publicly available allows original results to be reproduced and new analyses to be conducted. While sharing your data is the first step in allowing reuse, it is also important that the data be easy to understand and use. We describe nine simple ways to make it easy to reuse the data that you share and also make it easier to work with it yourself. Our recommendations focus on making your data understandable, easy to analyze, and readily available to the wider community of scientists.
Introduction
Sharing data is increasingly recognized as an important component of the scientific process (Whitlock, McPeek, Rausher, Rieseberg, & Moore, 2010). The sharing of scientific data is beneficial because it allows replication of research results and reuse in meta-analyses and projects not originally intended by the data collectors (Poisot, Mounce, & Gravel, 2013). In ecology and evolutionary biology, sharing occurs through a combination of formal data repositories like GenBank and Dryad, and through individual and institutional websites.
While data sharing is increasingly common and straightforward, much of the shared data in ecology and evolutionary biology are not easily reused because they do not follow best practices in terms of data structure, metadata, and licensing (M. B. Jones, Schildhauer, Reichman, & Bowers, 2006). This makes it more difficult to work with existing data and therefore makes the data less useful than it could be (M. B. Jones et al., 2006; O. J. Reichman, Jones, & Schildhauer, 2011). Here we provide a list of 9 simple ways to make it easier to reuse the data that you share.
Our recommendations focus on making your data understandable, easy to work with, and available to the wider community of scientists. They are designed to be simple and straightforward to implement, and as such represent an introduction to good data practices rather than a comprehensive treatment. We contextualize our recommendations with examples from ecology and evolutionary biology, though many of the recommendations apply broadly across scientific disciplines. Following these recommendations makes it easier for anyone to reuse your data including other members of your lab and even yourself.
1. Share your data
The first and most important step in sharing your data is to share your data. The recommendations below will help make your data more useful, but sharing it in any form is a big step forward. So, why should you share your data?
Data sharing provides substantial benefits to the scientific community (Fienberg & Martin, 1985). It allows
- the results of existing analyses to be reproduced and improved upon (Fienberg & Martin, 1985; Poisot et al., 2013),
- data to be combined in meta-analyses to reach general conclusions (Fienberg & Martin, 1985),
- new approaches to be applied to the data and new questions asked using it (Fienberg & Martin, 1985), and
- approaches to scientific inquiry that couldn’t even be considered without broad scale data sharing (Hampton et al., 2013).
As a result, data sharing is increasingly required by funding agencies (Poisot et al. (2013); e.g., NSF, NIH, NSERC, FWF), journals (Whitlock et al., 2010), and potentially by law (e.g. FASTR).
Despite these potential benefits to the community, many scientists are still reluctant to share data. This reluctance is largely due to perceived fears of 1) competition for publications based on the shared data, 2) technical barriers, and 3) a lack of recognition for sharing data (Hampton et al., 2013; Palmer et al., 2004). These concerns are often not as serious as they first appear, and the minimal costs associated with data sharing are frequently offset by individual benefits to the data sharer (Hampton et al., 2013; Parr & Cummings, 2005). Many data sharing initiatives allow for data embargoes or limitations on direct competition that can last for several years while the authors develop their publications and thus avoid competition for deriving publications from the data. Also, logistical barriers to data sharing are diminishing as data archives become increasingly common and easy to use (Hampton et al., 2013; Parr & Cummings, 2005). Datasets are now considered citable entities and data providers receive recognition in the form of increased citation metrics and credit on CVs and grant applications (Heather A Piwowar & Vision, 2013; Heather A. Piwowar, Day, & Fridsma, 2007; Poisot et al., 2013). In addition to increased citation rates, shared datasets that are documented and standardized are also more easily reused in the future by the original investigator. As a result, it is increasingly beneficial to the individual researcher to share data in the most useful manner possible.
2. Provide metadata
The first key to using data is understanding it. Metadata is information about the data including how it was collected, what the units of measurement are, and descriptions of how to best use the data. Clear metadata makes it easier to figure out if a dataset is appropriate for a project. It also makes data easier to use by both the original investigators and by other scientists by making it easy to figure out how to work with the data. Without clear metadata, datasets can be overlooked or not used due to the difficulty of understanding the data (Fraser & Gluck, 1999; A. S. Zimmerman, 2003), and the data becomes less useful over time (Michener, Brunt, Helly, Kirchner, & Stafford, 1997).
Metadata can take several forms, including descriptive file and column names, a written description of the data, images (i.e., maps, photographs), and specially structured information that can be read by computers. Good metadata should provide 1) the what, when, where, and how of data collection, 2) how to find and access the data, 3) suggestions on the suitability of the data for answering specific questions, 4) warnings about known problems or inconsistencies in the data, and 5) information to check that the data are properly imported, such as the number of rows and columns in the dataset and the total sum of numerical columns (Michener et al., 1997; Strasser, Cook, Michener, & Budden, 2012; A. S. Zimmerman, 2003).
Just like any other scientific publication, metadata should be logically organized, complete, and clear enough to enable interpretation and use of the data (A. Zimmerman, 2007). Specific metadata standards exist (e.g., Ecological Metadata Language EML, Directory Interchange Format DIF, Darwin Core DWC (Wieczorek et al., 2012), Dublin Core Metadata Initiative DCMI, Federal Geographic Data Committee FGDC (O. J. Reichman et al., 2011; Whitlock, 2011). These standards are designed to provide consistency in metadata across different datasets and also to allow computers to interpret the metadata automatically. This allows broader and more efficient use of shared data (Brunt, McCartney, Baker, & Stafford, 2002; M. B. Jones et al., 2006). While following these standards is valuable, the most important thing is to have metadata at all.
You don’t need to spend a lot of extra time to write good metadata. The easiest way to develop metadata is to start describing your data during the planning and data collection stages. This will help you stay organized, make it easier to work with your data after it has been collected, and make eventual publication of the data easier. If you decide to take the extra step and follow metadata standards, there are tools designed to make this easier including: KNB Morpho, USGS xtme, and FGDC workbook.
3. Provide an unprocessed form of the data
Often, the data used in scientific analyses are modified in some way from the original form in which they were collected. This is done to address the questions of interest in the best manner possible and to address common limitations associated with the raw data. However, the best way to process data depends on the question being asked and corrections for common data limitations often change as better approaches are developed. It can also be very difficult to combine data from multiple sources that have each been processed in different ways. Therefore, to make your data as useful as possible it is best to share the data in as raw a form as possible.
This is not to say that your data are best suited for analysis in the raw form, but providing it in the raw form gives data users the most flexibility. Of course, your work to develop and process the data is also very important and can be quite valuable for other scientists using your data. This is particularly true when correcting data for common limitations. Providing both the raw and processed forms of the data, and clearly explaining the differences between them in the metadata, is an easy way to include the benefits of both data forms. An alternate approach is to share the unprocessed data along with the code that process the data to the form you used for analysis. This allows other scientists to assess and potentially modify the process by which you arrived at the values used in your analysis.
4. Use standard data formats
Everyone has their own favorite tools for storing and analyzing data. To make it easy to use your data it is best to store it in a standard format that can be used by many different kinds of software. Good standard formats include the type of file, the overall structure of the data, and the specific contents of the file.
Use standard file formats
You should use file formats that are readable by most software and, when possible, are non-proprietary (Borer, Seabloom, Jones, & Schildhauer, 2009; Strasser, Cook, Michener, Budden, & Koskela, 2011; Strasser et al., 2012). Certain kinds of data in ecology and evolution have well established standard formats such as FASTA files for nucleotide or peptide sequences and the Newick files for phylogenetic trees. Use these well defined formats when they exist, because that is what other scientists and most existing software will be able to work with most easily.
Data that does not have a well defined standard format is often stored in tables. Tabular data should be stored in a format that can be opened by any type of software to increase reuseability of the data, i.e. text files. These text files use delimiters to indicate different columns. Commas are the most commonly used delimiter (i.e., comma-delimited text files with the .csv extension). Tabs can also be used as a delimiter, although problems can occur in displaying the data correctly when importing data from one program to another. In contrast to plain text files, proprietary formats such as those used by Microsoft Excel (e.g, .xls, .xlsx) can be difficult to load into other programs. In addition, these types of files can become obsolete, eventually making it difficult to open the data files at all if the newer versions of the software no longer support the original format (Borer et al., 2009; Strasser et al., 2011, 2012).
When naming files you should use descriptive names so that it is easy to keep track of what data they contain (Borer et al., 2009; Strasser et al., 2011, 2012). If there are multiple files in a dataset, name them in a consistent manner to make it easier to automate working with them. You should also avoid spaces in file names, which can cause problems for some software (Borer et al., 2009). Spaces in file names can be avoided by using camel case (e.g, RainAvg) or by separating the words with underscores (e.g., rain_avg).
Use standard table formats
Data tables are ubiquitous in ecology and evolution. Tabular data provides a great deal of flexibility in how to structure the data, which makes it easy to structure the data in a way that is difficult to (re)use. We provide three simple recommendations to help ensure that tabular data are properly structured to allow the data to be easily imported and analyzed by most data management systems and common analysis software, such as R and Python.
- Each row should represent a single observation (i.e., a record) and each column should represent a single variable or type of measurement (i.e., a field) (Borer et al., 2009; Strasser et al., 2011, 2012). This is the standard format for tables in the most commonly used database management systems and analysis packages and makes the data easy to work with in the most general way.
- Every cell should contain only a single value (Strasser et al., 2012). For example, do not include units in the cell with the values (Figure 1) or include multiple measurements in a single cell, and break taxonomic information up into single components with one column each for family, genus, species, subspecies, etc. Violating this rule makes it difficult to process or analyze your data using standard tools, because there is no easy way for the software to treat the items within a cell as separate pieces of information.
- There should only be one column for each type of information (Borer et al., 2009; Strasser et al., 2011, 2012). The most common violation of this rule is cross-tab structured data, where different columns contain measurements of the same variable (e.g., in different sites, treatments, etc.; Figure 1).
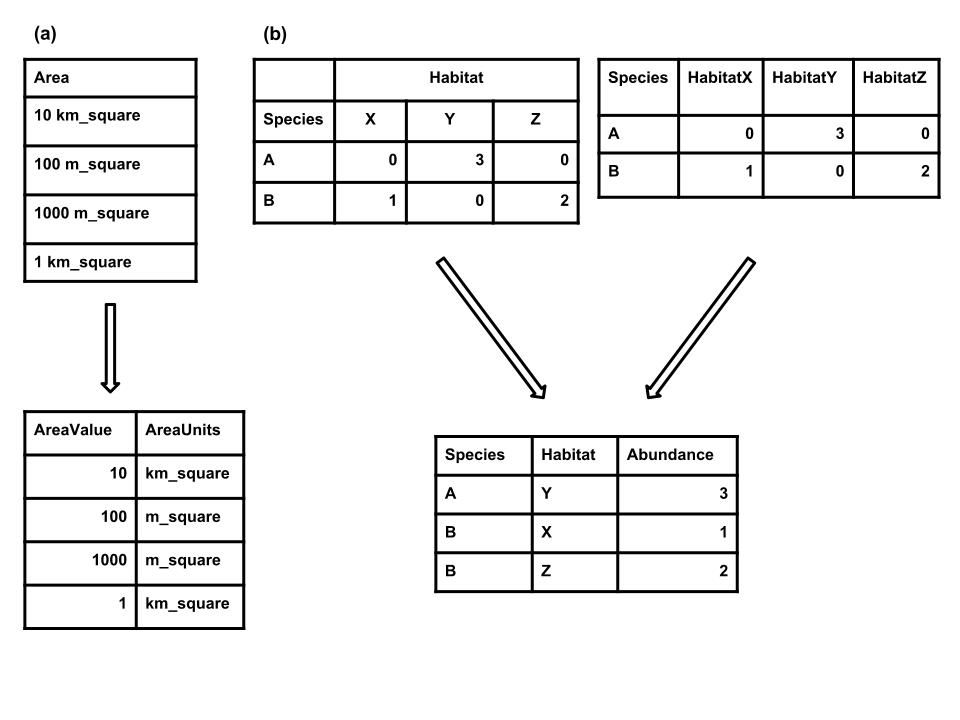
While cross-tab data can be useful for its readability, and may be appropriate for data collection, this format makes it difficult to link the records with additional data (e.g., the location and environmental conditions at a site) and it cannot be properly used by most common database management and analysis tools (e.g., relational databases, dataframes in R and Python, etc.). If tabular data are currently in a cross-tab structure, there are tools to help restructure the data including functions in Excel, R (e.g., melt() function in the R package reshape; Wickham (2007)), and Python (e.g., melt() function in the Pandas Python module.
In addition to following these basic rules you should also make sure to use descriptive column names (Borer et al., 2009). Descriptive column names make the data easier to understand and therefore make data interpretation errors less likely. As with file names, spaces can cause problems for some software and should be avoided.
Use standard formats within cells
In addition to using standard table structures it is also important to ensure that the contents of each cell don’t cause problems for data management and analysis software. Specifically, we recommend:
- Be consistent. For example, be consistent in your capitalization of words, choice of delimiters, and naming conventions for variables.
- Avoid special characters. Most software for storing and analyzing data works best on plain text, and accents and other special characters can make it difficult to import your data (Borer et al., 2009; Strasser et al., 2012).
- Avoid using your delimiter in the data itself (e.g., commas in the notes filed of a comma-delimited file). This can make it difficult to import your data properly. This means that if you are using commas as the decimal separator (as is often done in continental Europe) then you should use a non-comma delimiter (e.g., a tab).
- When working with dates use the YYYY-MM-DD format (i.e., follow the ISO 8601 data standard).
5. Use good null values
Most ecological and evolutionary datasets contain missing or empty data values. Working with this kind of “null” data can be difficult, especially when the null values are indicated in problematic ways. Unfortunately, there are many different ways to indicate a missing/empty value, and very little agreement on which approach to use.
We recommend choosing a null value that is both compatible with most software and unlikely to cause errors in analyses (Table 1). The null value that is most compatible with the software commonly used by biologists is the blank (i.e., nothing; Table 1). Blanks are automatically treated as null values by R, Python, SQL, and Excel. They are also easily spotted in a visual examination of the data. Note that a blank involves entering nothing, it is not a space, so if you use this option make sure there aren’t any hidden spaces. There are two potential issues with blanks that should be considered:
- It can be difficult to know if a value is missing or was overlooked during data entry.
- They can be confusing when spaces or tabs are used as delimiters in text files.
NA and NULL are reasonable null values, but they are only handled automatically by a subset of commonly used software (Table 1). NA can also be problematic if it is also used as an abbreviation (e.g., North America, Namibia, Neotoma albigula, sodium, etc.). We recommend against using numerical values to indicate nulls (e.g., 999, -999, etc.) because they typically require an extra step to remove from analyses and can be accidentally included in calculations. We also recommend against using non-standard text indications (e.g., No data, ND, missing, —) because they can cause issues with software that requires consistent data types within columns). Whichever null value that you use, only use one, use it consistently throughout the data set, and indicate it clearly in the metadata.
| Null values | Problems | Compatibility | Recommendation |
|---|---|---|---|
0 | Indistinguishable from a true zero | Never use | |
blank | Hard to distinguish values that are missing from those overlooked on entry. Hard to distinguish blanks from spaces, which behave differently. | R, Python, SQL | Best option |
999, -999 | Not recognized as null by many programs without user input. Can be inadvertently entered into calculations. | Avoid | |
NA, na | Can also be an abbreviation (e.g., North America), can cause problems with data type (turn a numerical column into a text column). NA is more commonly recognized than na. | R | Good option |
N/A | An alternate form of NA, but often not compatible with software | Avoid | |
NULL | Can cause problems with data type | SQL | Good option |
None | Can cause problems with data type | Python | Avoid |
No data | Can cause problems with data type, contains a space | Avoid | |
Missing | Can cause problems with data type | Avoid | |
-,+,. | Can cause problems with data type | Avoid |
6. Make it easy to combine your data with other datasets
Ecological and evolutionary data are often most valuable when combined with other kinds of data (e.g., taxonomic, environmental). You can make it easier to combine your data with other data sources by including the data that is common across many data sources (e.g., Latin binomials, latitudes and longitudes) It is common for data to include codes or abbreviations. For example, in ecology and evolution codes often appear in place of site locations or taxonomy. This is useful because it reduces data entry (e.g., DS instead of Dipodomys spectabilis) and redundancy (a single column for a species ID rather than separate columns for family, genus, and species). However, without clear definitions these codes can be difficult to understand and make it more difficult to connect your data with external sources. The easiest way to link your data to other datasets is to include additional tables that contain a column for the code and additional columns that describe the item in the standard way. For example, you might include a table with the species codes followed by their most current family, genus, and specific epithet. For site location, you could include a table with the site code followed by latitude and longitude. Linked tables can also be used to include additional information about your data, such as spatial extent, temporal duration, and other appropriate details.
7. Perform basic quality control
Data, just like any other scientific product, should undergo some level of quality control (O. J. Reichman et al., 2011). This is true regardless of whether you plan to share the data because quality control will make it easier to analyze your own data and decrease the chance of making mistakes. However, it is particularly important for data that will be shared because scientists using the data won’t be familiar with quirks in the data and how to work around them.
At its most basic, quality control can consist of a few quick sanity checks of the data. More advanced quality control can include automated checks on data as it is entered and double-entry of data (Lampe & Weiler, 1998; Paulsen, Overgaard, & Lauritsen, 2012). This additional effort can be time consuming, but is valuable because it increases data accuracy by catching typographical errors, reader/recorder error, out-of-range values, and questionable data in general (Lampe & Weiler, 1998; Paulsen et al., 2012).
Before sharing your data we recommend performing a quick “data review”. Start by performing some basic sanity checks on your data. For example:
- If a column should contain numeric values, check that there are no non-numeric values in the data.
- Check that empty cells actually represent missing data, and not mistakes in data entry, and indicate that they are empty using the appropriate null values (see recommendation 6).
- Check for consistency in unit of measurement, data type (e.g., numeric, character), naming scheme (e.g., taxonomy, location), etc.
These checks can be performed by carefully looking at the data or can be automated using common programming and analysis tools like R or Python.
Then ask someone else to look over your metadata and data and provide you with feedback about anything they didn’t understand. In the same way that friendly reviews of papers can help catch mistakes and identify confusing sections of papers, a friendly review of data can help identify problems and things that are unclear in the data and metadata.
8. Use an established repository
For data sharing to be effective, data should be easy to find, accessible, and stored where it will be preserved for a long time (Kowalczyk & Shankar, 2011). To make your data (and associated code) visible and easily accessible, and to ensure a permanent link to a well maintained website, we suggest depositing your data in one of the major well-established repositories. This guarantees that the data will be available in the same location for a long time, in contrast to personal and institutional websites that do not guarantee the long-term persistence of the data. There are repositories available for sharing almost any type of biological or environmental data. Repositories that host specific data types, such as molecular sequences (e.g., DDBJ, GenBank, MG-RAST), are often highly standardized in data type, format, and quality control approaches. Other repositories host a wide array of data types and are less standardized (e.g., Dryad, KNB, PANGAEA). In addition to the repositories focused on the natural sciences there are also all purpose repositories where data of any kind can be shared (e.g., figshare).
When choosing a repository you should consider where other researchers in your discipline are sharing their data. This helps you quickly identify the community’s standard approach to sharing and increases the likelihood that other scientists will discover your data. In particular, if there is a centralized repository for a specific kind of data (e.g., GenBank for sequence data) then you should use that repository.
In cases where there is no de facto standard it is worth considering differences among repositories in terms of use, data rights, and licensing (Table 2) and whether your funding agency or journal has explicit requirements or restrictions related to repositories. We also recommend that you use a repository that allows your dataset to be easily cited. Most repositories will describe how this works, but an easy way to guarantee that your data are citable is to confirm that the repository associates it with a persistent identifier, the most popular of which is the digital object identifier (DOI). DOIs are permanent unique identifiers that are independent of physical location and site ownership. There are also online tools for finding good repositories for your data including Databib and re3data.
| Repository | License | DOI | Metadata | Access | Notes |
|---|---|---|---|---|---|
Dryad | CC0 | Yes | Suggested | Open | Ecology & evolution data associated with publications |
Ecological Archives | No | Yes | Required | Open | Publishes supplemental data for ESA journals and stand alone data papers |
Knowledge Network for Biocomplexity | No | Yes | Required | Variable | Partners with ESA, NCEAS, DataONE |
Paleobiology Database | Various CC | No | Optional | Variable | Paleontology specific |
Data Basin | Various CC | No | Optional | Open | GIS data in ESRI files, limited free space |
Pangaea | Various CC | Yes | Required | Variable | Editors participate in QA/QC |
figshare | CC0 | Yes | Optional | Open | Also allows deposition of other research outputs and private datasets |
9. Use an established and liberal license
Including an explicit license with your data is the best way to let others know exactly what they can and cannot do with the data you shared. Following the Panton Principles we recommend:
- Using well established licenses in order to clearly communicate the rights and responsibilities of both the people providing the data and the people using it.
- Using the most open license possible, because even minor restrictions on data use can have unintended consequences for the reuse of the data (Poisot et al., 2013; Schofield et al., 2009).
The Creative Commons Zero license (CC0) places no restrictions on data use and is considered by many to be one of the best license for sharing data (e.g., (Poisot et al., 2013; Schofield et al., 2009), Why does Dryad use CC0). Having a clear and open license will increase the chance that other scientists will be comfortable using your data.
Concluding remarks
Data sharing has the potential to transform the way we conduct ecological and evolutionary research (Fienberg & Martin, 1985; Poisot et al., 2013; Whitlock et al., 2010). As a result, there are an increasing number of initiatives at the federal, funding agency, and journal levels to encourage or require the sharing of the data associated with scientific research (Heather A Piwowar & Chapman, 2008; Poisot et al., 2013; Whitlock et al., 2010). However, making the data available is only the first step. To make data sharing as useful as possible it is necessary to make the data usable with as little effort as possible (M. B. Jones et al., 2006; O. J. Reichman et al., 2011). This allows scientists to spend their time doing science rather than cleaning up data.
We have provided a list of 9 practices that require only a small additional time investment but substantially improve the usability of data. These practices can be broken down into three major groups.
- Well documented data are easier to understand.
- Properly formatted data are easier to use in a variety of software.
- Data that is shared in established repositories with open licenses is easier for others to find and use.
Most of these recommendations are simply good practice for working with data regardless of whether that data are shared or not. This means that following these recommendations (2-7) make the data easier to work with for anyone, including you. This is particularly true when returning to your own data for further analysis months or years after you originally collected or analyzed it. In addition, data sharing often occurs within a lab or research group. Good data sharing practices make these in-house collaborations faster, easier, and less dependent on lab members who may have graduated or moved on to other things.
By following these practices we can assure that the data collected in ecology and evolution can be used to its full potential to improve our understanding of biological systems.
Acknowledgments
Thanks to Karthik Ram for organizing this special section and inviting us to contribute. Carly Strasser and Kara Woo recommended important references and David Harris and Carly Strasser provided valuable feedback on null values, all via Twitter. Carl Boettiger, Matt Davis, Daniel Hocking, Heinz Pampel, Karthik Ram, Thiago Silva, Carly Strasser, Tom Webb, and beroe (Twitter handle) provided value comments on the manuscript. Many of these comments were part of the informal review process facilitated by posting this manuscript as a preprint. The writing of this paper was supported by a CAREER grant from the U.S. National Science Foundation (DEB 0953694) to EPW. A peer-reviewed version of this preprint is available.
References
- Borer, E. T., Seabloom, E. W., Jones, M. B., & Schildhauer, M. (2009). Some simple guidelines for effective data management. Bulletin of the Ecological Society of America, 90(2), 205–214. Retrieved from http://dx.doi.org/10.1890/0012-9623-90.2.205
- Brunt, J. W., McCartney, P., Baker, K., & Stafford, S. G. (2002). The future of ecoinformatics in long term ecological research. In Proceedings of the 6th world multiconference on systemics, cybernetics and informatics: SCI (pp. 14–18).
- Fienberg, S. E., & Martin, M. E. (1985). Sharing research data. Natl Academy Pr.
- Fraser, B., & Gluck, M. (1999). Usability of geospatial metadata or space-time matters. Bulletin of the American Society for Information Science and Technology, 25(6), 24–28. Retrieved from http://dx.doi.org/10.1002/bult.134
- Hampton, S. E., Strasser, C. A., Tewksbury, J. J., Gram, W. K., Budden, A. E., Batcheller, A. L., … Porter, J. H. (2013). Big data and the future of ecology. Frontiers in Ecology and the Environment, 11(3), 156–162. Retrieved from http://dx.doi.org/10.1890/120103
- Jones, M. B., Schildhauer, M. P., Reichman, O., & Bowers, S. (2006). The new bioinformatics: Integrating ecological data from the gene to the biosphere. Annual Review of Ecology, Evolution, and Systematics, 37(1), 519–54. Retrieved from http://dx.doi.org/10.1146/annurev.ecolsys.37.091305.110031
- Kowalczyk, S., & Shankar, K. (2011). Data sharing in the sciences. Annual Review of Information Science and Technology, 45(1), 247–294. Retrieved from http://dx.doi.org/10.1002/aris.2011.1440450113
- Lampe, A., & Weiler, J. (1998). Data capture from the sponsors’ and investigators’ perspectives: Balancing quality, speed, and cost. Drug Information Journal, 32(4), 871–886.
- Michener, W. K., Brunt, J. W., Helly, J. J., Kirchner, T. B., & Stafford, S. G. (1997). Nongeospatial metadata for the ecological sciences. Ecological Applications, 7(1), 330–342. Retrieved from http://dx.doi.org/10.1890/1051-0761(1997)007[0330:nmftes]2.0.co;2
- Palmer, M. A., Bernhardt, E. S., Chornesky, E. A., Collins, S. L., Dobson, A. P., Duke, C. S., … Turner, M. G. (2004). Ecological science and sustainability for a crowded planet. Retrieved from http://www.esa.org/ecovisions/ppfiles/EcologicalVisionsReport.pdf
- Parr, C., & Cummings, M. (2005). Data sharing in ecology and evolution. Trends in Ecology & Evolution, 20(7), 362–363. Retrieved from http://dx.doi.org/10.1016/j.tree.2005.04.023
- Paulsen, A., Overgaard, S., & Lauritsen, J. M. (2012). Quality of data entry using single entry, double entry and automated forms processing–An example based on a study of patient-reported outcomes. PloS ONE, 7(4), e35087. Retrieved from http://dx.doi.org/10.1371/journal.pone.0035087
- Piwowar, H. A., & Chapman, W. W. (2008). A review of journal policies for sharing research data. In ELPUB2008.
- Piwowar, H. A., & Vision, T. J. (2013). Data reuse and the open data citation advantage. PeerJ PrePrints, 1, e1. Retrieved from http://dx.doi.org/10.7287/peerj.preprints.1
- Piwowar, H. A., Day, R. S., & Fridsma, D. B. (2007). Sharing detailed research data is associated with increased citation rate. PLoS ONE, 2(3), e308. Retrieved from http://dx.doi.org/10.1371/journal.pone.0000308
- Poisot, T., Mounce, R., & Gravel, D. (2013). Moving toward a sustainable ecological science: Don’t let data go to waste! Retrieved from https://github.com/tpoisot/DataSharingPaper/blob/master/DataSharing-MS.md
- Reichman, O. J., Jones, M. B., & Schildhauer, M. P. (2011). Challenges and opportunities of open data in ecology. Science, 331(6018), 703–705. Retrieved from http://dx.doi.org/10.1126/science.1197962
- Schofield, P. N., Bubela, T., Weaver, T., Portilla, L., Brown, S. D., Hancock, J. M., … Rosenthal, N. (2009). Post-publication sharing of data and tools. Nature, 461(7261), 171–173. Retrieved from http://dx.doi.org/10.1038/461171a
- Strasser, C. A., Cook, R. B., Michener, W. K., Budden, A., & Koskela, R. (2011). Promoting data stewardship through best practices. In Proceedings of the environmental information management conference 2011 (eIM 2011). Oak Ridge National Laboratory (ORNL).
- Strasser, C. A., Cook, R., Michener, W. K., & Budden, A. (2012). Primer on data management: What you always wanted to know. DataONE. Retrieved from http://dx.doi.org/10.5060/D2251G48
- Whitlock, M. C. (2011). Data archiving in ecology and evolution: Best practices. Trends in Ecology & Evolution, 26(2), 61–65. Retrieved from http://dx.doi.org/10.1016/j.tree.2010.11.006
- Whitlock, M. C., McPeek, M. A., Rausher, M. D., Rieseberg, L., & Moore, A. J. (2010). Data archiving. The American Naturalist, 175(2), 145–146. doi:10.1086/650340
- Wickham, H. (2007). Reshaping data with the reshape package. Journal of Statistical Software, 21(12). Retrieved from http://www.jstatsoft.org/v21/i12/paper
- Wieczorek, J., Bloom, D., Guralnick, R., Blum, S., Döring, M., Giovanni, R., … Vieglais, D. (2012). Darwin core: An evolving community-developed biodiversity data standard. PLoS ONE, 7(1), e29715. doi:10.1371/journal.pone.0029715
- Zimmerman, A. (2007). Not by metadata alone: The use of diverse forms of knowledge to locate data for reuse. International Journal on Digital Libraries, 7(1-2), 5–16. doi:10.1007/s00799-007-0015-8
- Zimmerman, A. S. (2003). Data sharing and secondary use of scientific data: Experiences of ecologists (PhD thesis). The University of Michigan.
