Today DataCite launches a new API that powers the PID Graph, the graph formed by scholarly resources described by persistent identifiers (PIDs) and the connections between them. The API is powered by GraphQL, a widely adopted Open Source technology that enables queries of this graph, addressing use cases of our community in ways that were not possible before.
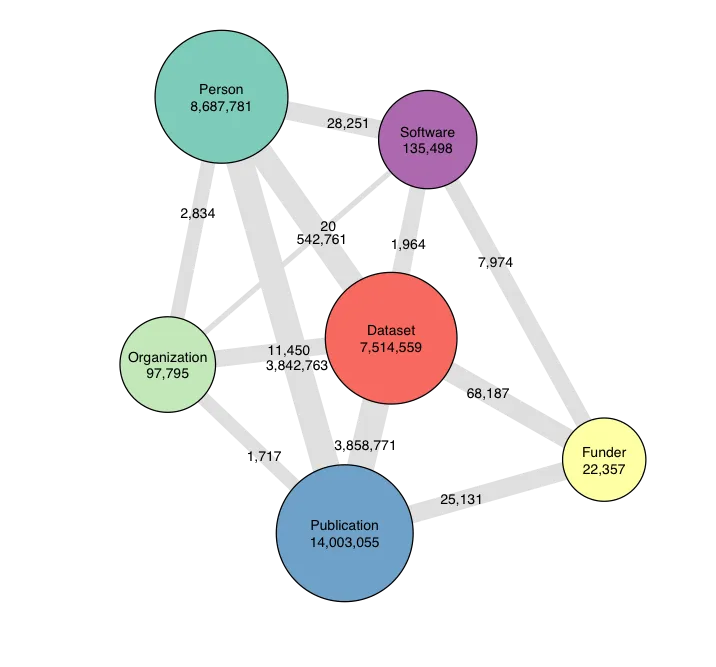
We launched a pre-release version of the API in May 2019 (Fenner (2019b))[], and have used the last 12 months to improve the performance and stability of the service, add functionality based on user feedback, decide on a stable GraphQL schema that describes the resources and links in the Graph, and add many additional resources. The PID Graph now includes all of DataCite's DOIs, nine million Crossref DOIs, all ORCID IDs, and all Research Organization Registry (ROR), Crossref Funder ID, and Registry of Research Data Repositories (re3data) records, for a total of about 35 million resources with PIDs and associated metadata, and about 9 million links between them.
The PID Graph and the GraphQL API announced today are an important output from the European Commission-funded FREYA Project (grant agreement No 777523), and have been developed in close collaboration with all FREYA partners, including the PID providers Crossref and ORCID. PID Graph is part of the Research Data Alliance (RDA) Open Science Graphs for FAIR Interest Group, where we coordinate with other initiatives building Open Science graphs.
FREYA partners have used the last 12 months to start building client applications that take advantage of the GraphQL API, and you will see two new services built by DataCite using GraphQL launching later this year. While GraphQL is supported by a wide variety of programming languages, with lots of documentation and community support available – including of course the DataCite GraphQL API Guide - it is a relatively new technology for scholarly communication infrastructure. We found that Jupyter notebooks are a powerful way to get started with the PID Graph and the DataCite GraphQL API Fenner (2019c), and you find a number of example notebooks via the PID Graph section in the PID Forum, which is also a good place to post questions or comments. The visualization in this blog post is of course also generated by a Jupyter notebook using the DataCite GraphQL API Fenner (2019a). Expect more Jupyter notebooks coming from FREYA in the coming months, addressing specific user stories that we have identified earlier in the project.
Acknowledgments
This blog post was originally published on the DataCite Blog. This work was funded by the European Union’s Horizon 2020 research and innovation programme under grant agreement No. 777523.
References
Fenner, M. (2019a). FREYA pid graph key performance indicators (kpis). DataCite. https://doi.org/10.14454/3BPW-W381
Fenner, M. (2019b). The datacite graphql api is now open for (pre-release) business. https://doi.org/10.5438/QAB1-N315
Fenner, M. (2019c). Using jupyter notebooks with graphql and the pid graph. https://doi.org/10.5438/HWAW-XE52
