The connections between scholarly resources generated by persistent identifiers (PIDs) and associated metadata form a graph: the PID Graph [Fenner & Aryani (2019)]. We developed this PID Graph concept in the EC-funded FREYA project, and have identified important use cases and technical requirements. In May, DataCite introduced a GraphQL API to standardize and simplify how users can contribute to and consume the PID Graph [Fenner (2019b)]. Today we are announcing another important milestone: we added the required functionality to the DataCite GraphQL API that allows us to keep track of the growth of the PID Graph in terms of nodes (resources) and edges (connections). As before, we are using a Jupyter notebook to analyze and visualize the data.
The graph visualizes the main resources currently available via the DataCite GraphQL API, and their connections. The required data are fetched via a single GraphQL API call:
{
publications {
totalCount
publicationConnectionCount
datasetConnectionCount
softwareConnectionCount
researcherConnectionCount
funderConnectionCount
}
datasets {
totalCount
datasetConnectionCount
softwareConnectionCount
researcherConnectionCount
funderConnectionCount
}
softwares {
totalCount
softwareConnectionCount
researcherConnectionCount
funderConnectionCount
}
researchers {
totalCount
}
funders {
totalCount
}
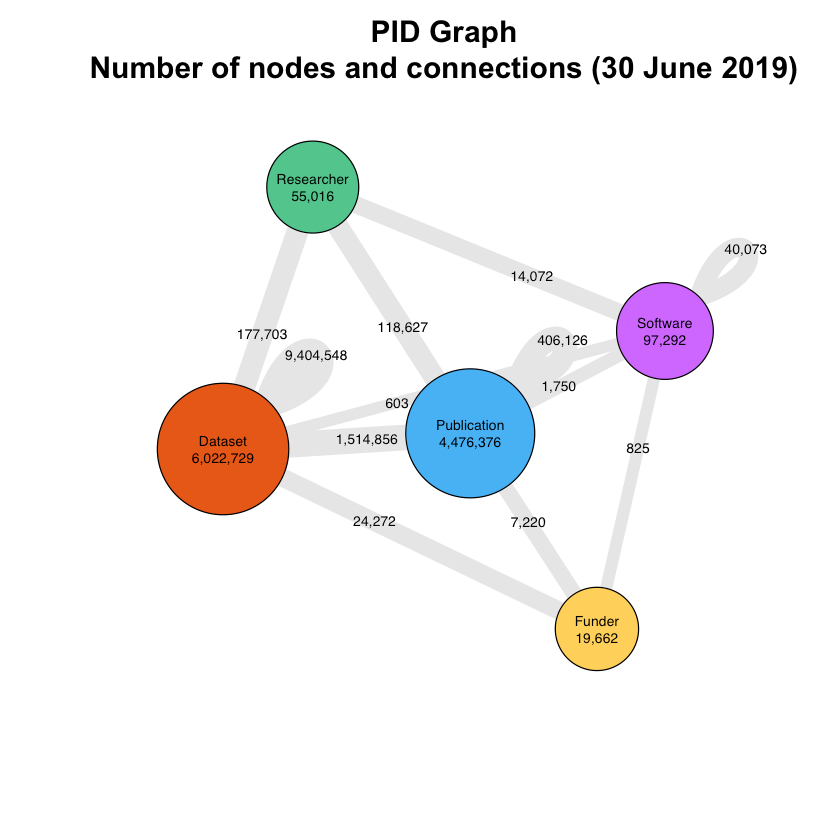
}The numbers reflect what is currently available via the DataCite GraphQL API, not the total number of publications, datasets, etc. with persistent identifiers and linking metadata. This includes all publications, datasets and software with DataCite DOIs, all funders in the Crossref Open Funder Registry, publications with Crossref DOIs linked to at least one DataCite DOI, and all researchers with an ORCID identifier linked to at least one DataCite DOI. A lot of work remains to be done to include the other resources with persistent identifiers made available by FREYA partners, including Crossref, ORCID and EMBL-EBI, as well as their connections. With this new API functionality we can now track the growth of the PID Graph with the key performance indicators (KPIs) number of nodes and number of connections.
A few interesting observations can be made from the visualization: not surprisingly, given that datasets currently make up the largest number of resources in the PID Graph, by far the largest number of connections (9.4 million) is between datasets and other datasets. Looking at the relation type of these connections in the Event Data API, most of them (8.5 million) don't describe versioning or granularity (HasPart/IsPartOf relations), but use the relation type references between two GBIF DOIs. This reflects the main use case for DOIs at GBIF, tracking occurrences of species.
The graph shows 1.5 million connections between publications and datasets, representing the data citations made available via the Crossref/DataCite Event Data Scholix API endpoint. Twenty-five percent of datasets with DataCite DOIs have been referenced in the scholarly literature, according to this graph. We also see the number of software citations using DataCite DOIs for software found in the scholarly literature, and we can use this API call to keep track of them. Similarly, we can track the number of datasets, publications, and software linked to researchers (via their ORCID ID), and funding (via the Crossref Funder ID), but keep in mind that connections to researchers and funding via Crossref are still missing.
The Jupyter notebook used to generate the visualization shown here is available via GitHub, where we store all PID Graph notebooks in a central repository. Starting with this notebook [Fenner (2019a)] we are also issuing DOIs for the notebooks, which we generate using a codemeta file hosted in the same folder as the notebook. This should make these notebooks easier to discover, and they also become part of the PID Graph.
Going forward we want to refine the GraphQL API to provide the numbers of nodes and connections as they change over time, making it easier to track progress. And of course, we will be adding more resource types and information from other FREYA partners. Keep an eye on this blog for further updates!
Acknowledgments
This blog post was originally published on the DataCite Blog. This work was funded by the European Union’s Horizon 2020 research and innovation programme under grant agreement No. 777523.
References
Fenner M. Jupyter Notebook FREYA PID Graph Key Performance Indicators (KPIs). Published online June 30, 2019. doi:10.14454/3BPW-W381
Fenner M. The DataCite GraphQL API is now open for (pre-release) business. Published online May 15, 2019. doi:10.53731/r79sa71-97aq74v-ag4vc
Fenner M, Aryani A. Introducing the PID Graph. Published online 2019. doi:10.5438/JWVF-8A66
