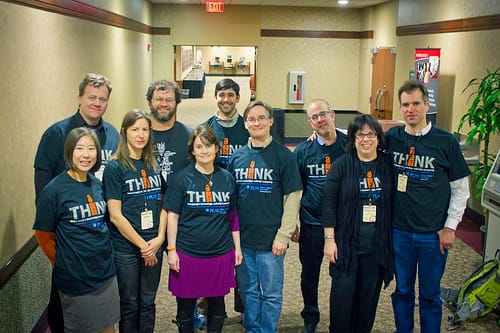
The ScienceOnline2012 conference last week again was a wonderful experience. This was my third time in North Carolina, and I had many great conversations in the sessions, hallways – and bars. One of many highlights was a lunch meeting with fellow PLoS bloggers and staffers.
Together with Euan Adie I moderated a session on Friday:
Using altmetrics tools to track the scholarly impact of your research.
We started the session by asking several people in the audience to demonstrate their altmetrics tools: altmetric.com (Euan Adie), ReaderMeter (Dario Taraborelli), Total Impact (Jason Priem), PLoS Article-Level Metrics (Jennifer Lin), and ScienceCard (me). We briefly showed our CrowdoMeter project where we crowdsourced the meaning of tweets about scholarly papers.
The discussion covered many interesting aspects. I would like to focus on three of them.
Gaming
Altmetrics are still fairly new, and therefore not many people try to the cheat yet (but almost 1% of tweets in the CrowdoMeter dataset were already spam). I’m sure that this will change over time, and some metrics will be more prone to gaming than others. Gaming is a particular problem for usage stats, as it is difficult to impossible to verify them. Metrics provided by the producer of a research object (author or publisher) will be more susceptible to gaming than metrics from an independent source. Anonymous metrics (e.g. Mendeley readers) are more susceptible to gaming than metrics that list the source of every citation (e.g. CiteULike bookmarks).
Context
Altmetrics is currently at a stage where we collect various metrics, but don’t really know what these numbers mean. Does 1,000 downloads, 10 Mendeley bookmarks or 50 tweets mean that the paper has impact? And how do we compare altmetrics from different disciplines? Does it make a difference if a Fields Medalist blogs about your paper (an example given in the session)? I think that the most interesting metrics are those that take into account who is citing the work, being it a regular citation, a social bookmark or a social media comment. This is of course how Google PageRank works for webpages, and how Eigenfactor ranks scholarly journals. The context can be further improved by including the social networks of the person looking for information, e.g. how many people I follow on Twitter have bookmarked this particular paper.
Scope
The tools discussed in the ScienceOnline session all have a particular approach for gathering altmetrics: altmetrics over a given time period (altmetric.com), altmetrics for content produced by a particular publisher (PLoS ALM), altmetrics for a given researcher (ReaderMeter and ScienceCard), and altmetrics produced for a given dataset on demand (Total-Impact). One obvious advantage of this approach is that it reduces the number of datasets needed to run the service. Unfortunately, this is an arbitrary distinction, and it falls apart when you use a PageRank approach and also look at the metrics of citing sources.
Conclusions
I think that altmetrics has made tremendous progress in 2011, but that there is a lot of work to do in 2012. I’m very interested in altmetrics based on PageRank, but also want to take social networks into consideration. This is of course how finding information on the web works – scholarly communication is just a subset. Unfortunately, this approach requires a massive database of scholarly citations, something that is impossible to do for the small part-time altmetrics projects mentioned at the beginning of the post.
I’m less interested in usage metrics because they are so prone to gaming and will probably become problematic in a few years, and I want to focus on a reasonable number of altmetrics. I hope that there will never be a single “altmetric”, but I also don’t think that we need 20 different altmetrics for every scholarly work. A lot of interesting work ahead for my ScienceCard project.
I’m looking forward to the altmetrics session at ScienceOnline2013.


