In December Euan Adie and I started the CrowdoMeter project, an analysis of the semantic content of tweets linking to scholarly papers. Because classifying almost 500 tweets is a lot of work, we turned this into a crowdsourcing project. We got help from 36 people, who did 953 classifications, and we discussed the preliminary results (available here) at the ScienceOnline2012 conference.
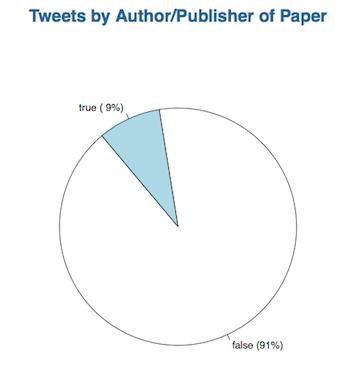
There is no reason to stop the crowdsourcing here, so we have uploaded the result set to figshare and invite everybody to help us with the data analysis. For this purpose I have created a public repository on Github which contains not only the source code for the CrowdoMeter website, but also all data – the same dataset made available on figshare. I have written a first R script that produces the following pie chart:
The figure doesn’t look all that exciting, but there is some calculation involved. There are different numbers of classifications per tweet and sometimes there is disagreement: true means at least 50% of classifications were true. It would be great if we find people willing to help with data analysis, preferably using R and contributing their scripts to the Github repository. Please send me an email or contact me via Twitter if you need write access to the repository.


