Last week I wrote about software.lagotto.io, an instance of the lagotto open source software collecting metrics for the about 1,400 software repositories included in Sciencetoolbox. In this post I want to report the first results analyzing the data.
If you want to follow along, please go to https://github.com/mfenner/software-analysis, this repository holds all the data, as well as the R code used for analysis. A special thanks goes to Scott Chamberlain who greatly helped me by tweaking the alm R package to support URLs instead of DOIs as identifiers.
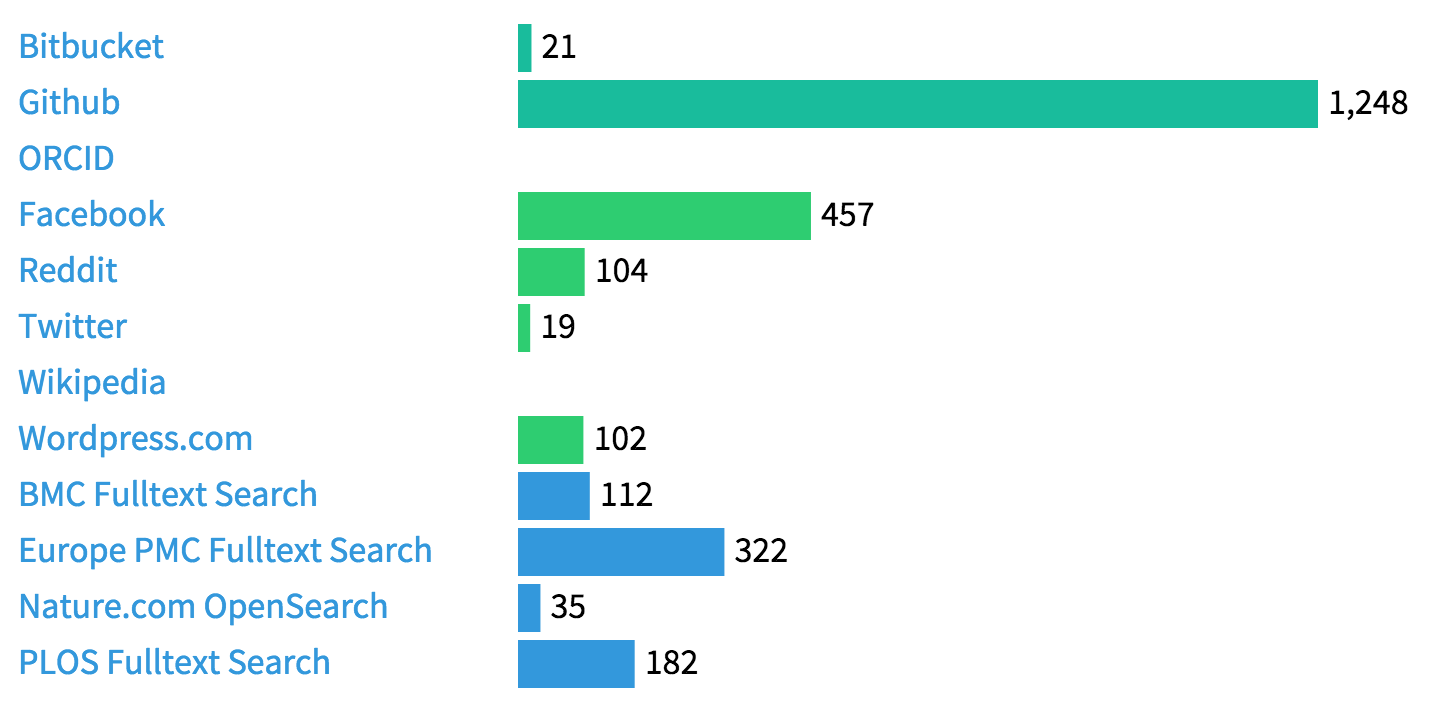
The first step in the analysis is to get an overview of the external sources citing or discussing the software package:
This is basically the same figure as in the previous post, but with two differences: I have added a Nature.com OpenSearch data source, and I have found an additional 64 repositories cited in scholarly articles via an Europe PMC full-text Search that also includes the reference lists (thanks to Jo McEntyre).
I am not sure why we are not picking up any Wikipedia citations, and have to take a closer look. The ORCID source also needs tweaking, and there are some issues with the Wordpress.com data that I have to look into as well. Citations in the scholarly literature are obviously the most interesting data, and we have three Github repos with more than 25 citations, including https://github.com/najoshi/sickle with 54 citations. As most repositories in our sample are cited only once if at all, a correlation with Github stars and forks is not useful. Sickle is popular on Github (52 stars and 32 forks), but it is not clear that this activity is correlated to citations (e.g. because there are more citations than stars).
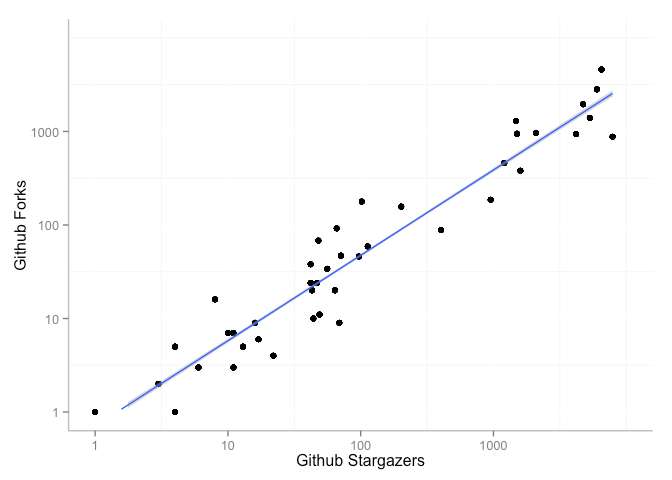
The vast majority of software repos in this analysis are hosted by Github, so we have the numbers of stars and forks for those. It is interesting, although probably not very surprising, that the number of Github stargazers and forks is highly correlated:
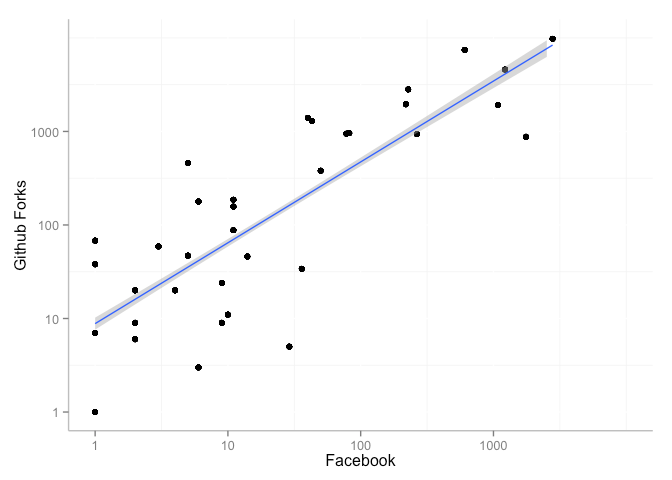
We can find Facebook activity (likes, comments or shares) for one third of the repositories. There is a reasonably good correlation between Facebook activity and number of Github forks:
One interesting analysis would be to look at the repositories that have been forked much more often relative to their Facebook activity, e.g. Impala with 1,207 Github stars and 458 forks, but only 5 Facebook shares. One limitation of the analysis is that we are not tracking Facebook (or other social media) activity for all forks of a repo.
We found Reddit discussions mentioning one of the repositories in 7% of cases. Once we have a larger sample size it would be interesting to correlate this activity with Github stars and forks, similar to what we did for Facebook. By far the most popular repository from our sample on Reddit is Bitcoin, followed by JQuery. Twitter activity is notoriously difficult to collect since Twitter doesn’t keep tweets very long, hence probably the low numbers compared to Facebook and Reddit.
Feel free to play with the data and scripts provided at https://github.com/mfenner/software-analysis, my next step is probably to include a much larger number of software repositories.
It has not escaped our notice that the kind of analysis described above could be applied to any software repository, not just scientific software.
