Two weeks ago DataCite announced the pre-release version of a GraphQL API [Fenner (2019)]. GraphQL simplifies complex queries that for example want to retrieve information about the authors, funding and data citations for a dataset with a DataCite DOI. These connections together form the PID Graph [Fenner & Aryani (2019)], and DataCite is working with the other partners in the EC-funded FREYA project on making it easier to contribute to the PID Graph, and consume information in the PID Graph.
Jupyter notebooks are a very popular web-based interactive computational environment and are the perfect platform to explore the PID Graph via GraphQL APIs. Since interactions with GraphQL APIs are standardized and GraphQL libraries exist for many programming languages supported by Jupyter notebooks, all the user has to do is come up with interesting queries and process the information returned from the API as JSON, following exactly the format of the query.
An example notebook can best explain this. We have created a GitHub repository for notebooks using the GraphQL API at https://github.com/datacite/notebooks, and you find this notebook in there. Open the notebook in your favorite Jupyter client (e.g. nteract) or look at it directly in GitHub.
The GraphQL query in the notebook is as follows:
{
  researcher(id: "https://orcid.org/0000-0003-1419-2405") {
    id
    name
    publications(first: 50) {
      totalCount
      nodes {
        id
        relatedIdentifiers {
          relatedIdentifier
        }
      }
    }
  }
}
This query will return the first 50 publications with DataCite DOIs linked to my ORCID ID, together with information about content referenced by these publications. The Jupyter notebook is then processing the JSON API response with two major outputs:
- two reference lists of all publications, and of all their references, using the APA citation style and the DOI citation formatter service.
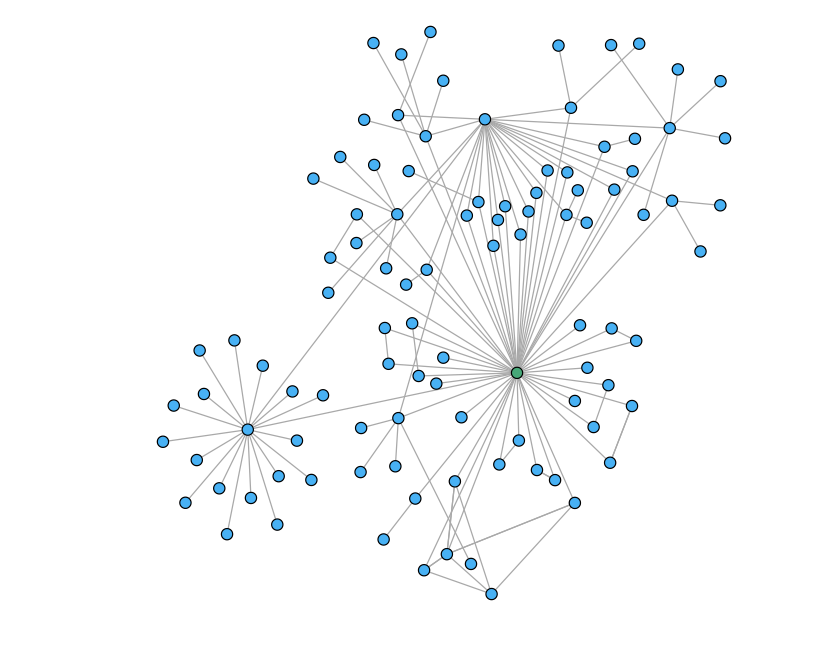
- a network graph of all publications and their references (blue circles), with a node (green circle) representing the author of these publications (me).
Even with only 50 publications the graph already is rather complicated. Many of my publications with DataCite DOIs are for the DataCite Blog, and you see them connected to a blue node in the top part of the graph. In the lower left corner you see a blog post with an unusually high number of references (Fenner, 2016). A number of publications appear as pairs linked to each other, reflecting the figshare approach to versioning.
This is only the starting point of what can be done with Jupyter notebooks and GraphQL, but it is clear that the possibilities are almost endless. You can use the above notebook as a starting point, e.g. to generate the graph of publications (with DataCite DOIs) using your ORCID ID. Or you do something very different, or use Python instead of R as programming language. You can of course contribute interesting notebooks to the above GitHub repository using a pull request.
Acknowledgments
This blog post was originally published on the DataCite Blog. This work was funded by the European Union’s Horizon 2020 research and innovation programme under grant agreement No. 777523.
References
- Fenner, M. (2016, December 23). Mysteries in Reference Lists. Front Matter. https://doi.org/10.53731/r79z0kh-97aq74v-ag5hb
- Fenner, M. (2019, May 15). The DataCite GraphQL API is now open for (pre-release) business. Front Matter. https://doi.org/10.53731/r79sa71-97aq74v-ag4vc
- Fenner, M., & Aryani, A. (2019). Introducing the PID Graph. https://doi.org/10.5438/JWVF-8A66


