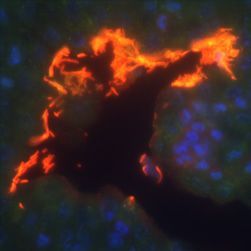
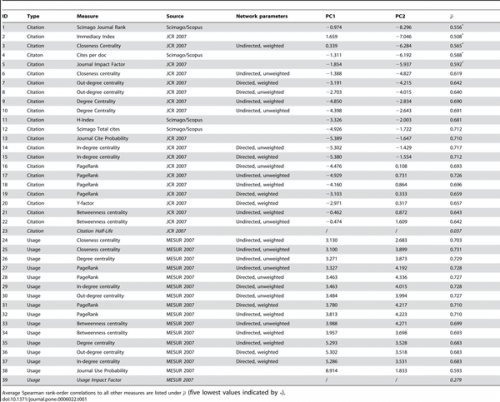
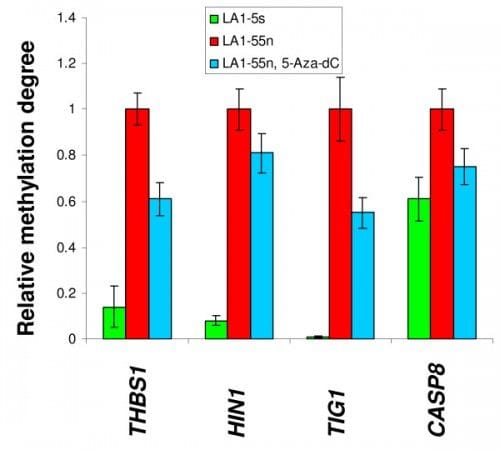
Tables and figures contain the data of a scientific paper in condensed (and often visually appealing) form. This is why they are among the first thing we look at, and why they are often reused when we discuss the paper in a presentation or blog post.

Electronic publication has dramatically simplified the reuse of tables and figures, and therefore reuse has become very common – you probably find reused material in most presentations given in academic institutions or at conferences.
Most authors will probably be happy that their results are disseminated, and reuse is likely to lead to more people reading the full paper and citing the work.
But this reuse has two problems. The first problem is copyright. Many journals own the copyright of the papers they publish and don’t allow reuse without prior permission. Unfortunately, copyright is a complicated issue, and also differs between countries. Most researchers assume “Fair use“ when they reuse material, but this might not apply to all situations, e.g. presentations at conferences. And many researchers don’t understand that they have often given away the copyright to their own works so that they can’t show a figure from one of their papers without permission.
Many publishers have automated the process of obtaining permissions for copyrighted work, e.g. using the Rightslink system of the Copyright Clearance Center. But it still requires a considerable investment in time (and often money) to obtain all permissions, especially since these are usually one-time permissions only. This combination of unawareness of the details of copyright law and the required extra work means that many researchers probably don’t obtain permission prior to reuse.
The solution to the copyright problems is obviously to use material with a Creative Commons license whenever possible, as I have done in this blog post. And most Open Access papers are published under this license, so there is plenty of material to choose from.
But there is also a second problem with reusing tables and figures. They were designed to be part of a paper and often look terrible in a presentation, particularly tables.

The solution to this problem is to provide the data behind the table or figure, so that the information can be displayed in a way that makes sense in a presentation. Here we usually have to reduce the amount of information, but it could also mean that we remix the content with other sources. The Creative Commons licenses discussed above are not appropriate for data. Whenever possible, scientific data should be placed in the public domain.
It is important to distinguish the publication of table and figure data from the publication of the whole research dataset. The open questions with the latter (e.g. standard data formats, appropriate repositories, archiving) don’t apply to the former. This means that publishers could start providing these data immediately. I’m confident that they would see an increase in paper downloads and citations. But more importantly, I hope this would lead to better presentations in seminars and at conferences.


