DNA Barcoding the Native Flowering Plants and Conifers of Wales has been one of the most popular new PLoS ONE papers in June. In the paper Natasha de Vere et al. describe a DNA barcode resource that covers the 1143 native Welsh flowering plants and conifers.
My new job as technical lead for the PLoS Article Level Metrics (ALM) project involves thinking about how we can best display the ALM collected for this and other papers. We want these ALM to tell us something important and/or interesting, and it doesn’t hurt if the information is displayed in a visually appealing way. There are many different ways this can be done, but here I want to focus on Twitter and CiteULike, the only two data sources where PLoS is currently storing every single event (tweet or CiteULike bookmark) with a date. Usage data (HTML and XML views, PDF downloads) are aggregated on a monthly basis, and PLoS doesn’t store the publication dates of citations.
We know from the work of Gunter Eysenbach and others that most tweets linking to scholarly papers are written in the first few days after publication. It therefore makes sense to display this information on a timeline covering the first 30 days after publication, and the tweets about the de Vere paper follow the same pattern.

I like the simplicity of sparklines. It would be interesting to also map the 274 Facebook Likes, Comments, and Shares, but we don’t have date information for them. The same is true for the 9 Mendeley readers and groups.
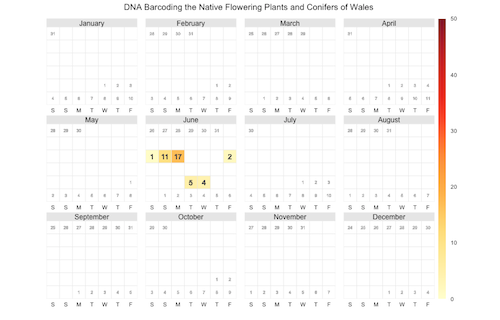
Another way to display the time course of tweets (or bookmarks) is to use a calendar heat map (the paper was published on June 6).

The chart looks a little bit empty, a calendar heat map probably works better for information with many daily data points. I would appreciate feedback on how these visualizations can be improved.
The charts were created with data from the PLoS ALM API and the statistical computing package R, the source code is available here and here.
